Oceans of Opportunity - Mid Year Report 2026
Article
Anyone who has spent time in the ocean learns, sooner or later, where waves come from. The clean, glassy sets that arrive on a perfect morning did not begin at the beach. They began days earlier and hundreds of miles away in violent storms and strong currents. Whether this raw energy arrives as surfable swell or unrideable chaos depends on what happens when it reaches shore. Period, angle, direction and the shape of the bottom all matter. The same force can produce very different outcomes depending on the conditions met.
We think about markets the same way. Headlines are the storms: unpredictable, unavoidable, and pouring raw energy into markets whether we like it or not. Whether that energy arrives as return or as drawdown is decided by the environment it lands in: positioning, liquidity, and correlation — the measurable footprint of investor behavior. And just as there are no waves without the storms that create them, there are no durable market advances without the periods of volatility that reset positioning, clear excess, and create the conditions for the next move.
The first half of 2026 was a reminder of that relationship. Markets moved from calm optimism to war with Iran and an oil shock, then from fear and forced deleveraging into one of the strongest recoveries in recent years. By June, enthusiasm had returned so completely that investors were celebrating SpaceX’s arrival in the public markets through the largest IPO in history. The destinations were very different, but the forces at work were the same: positioning, liquidity, correlation, volatility, and investor behavior.
Why We Invest This Way
Across retail, institutional and family office portfolios, one reality remains unchanged: long-term equity exposure is a foundational driver of most portfolios, and for good reason. For decades, U.S. equities have been the primary engine of real growth and inflation protection for liquid investments. The challenge for allocators is that the same equity exposure that drives long-term compounding is also the source of the drawdowns that strain client relationships, force reactive decisions and derail investment plans.
Our approach was built for that problem. We run a disciplined, quantitative process in U.S. equity indexes with two complementary engines. Long-term trend and momentum models participate while the primary trend is favorable. A short-term volatility overlay seeks opportunity and protection from price dislocations in the exact environments where traditional trend following struggles. Together they guide overall exposure across market regimes.
We call this full-cycle investing: managing the path, not just the destination, so that investors can stay invested long enough for compounding to do its work. The first half of 2026 put every part of that framework to the test.
Flat Water, Then the Set
The first four months of 2026 were that ocean in miniature. January was flat water. The S&P 500 gained 1.37% and at the index level the month looked uneventful. Underneath, single-stock volatility and dispersion were climbing steadily, leadership was rotating out of the crowded mega-cap technology names, and software repriced sharply as investors began asking whether artificial intelligence was a tailwind for subscription software businesses or a threat to them.
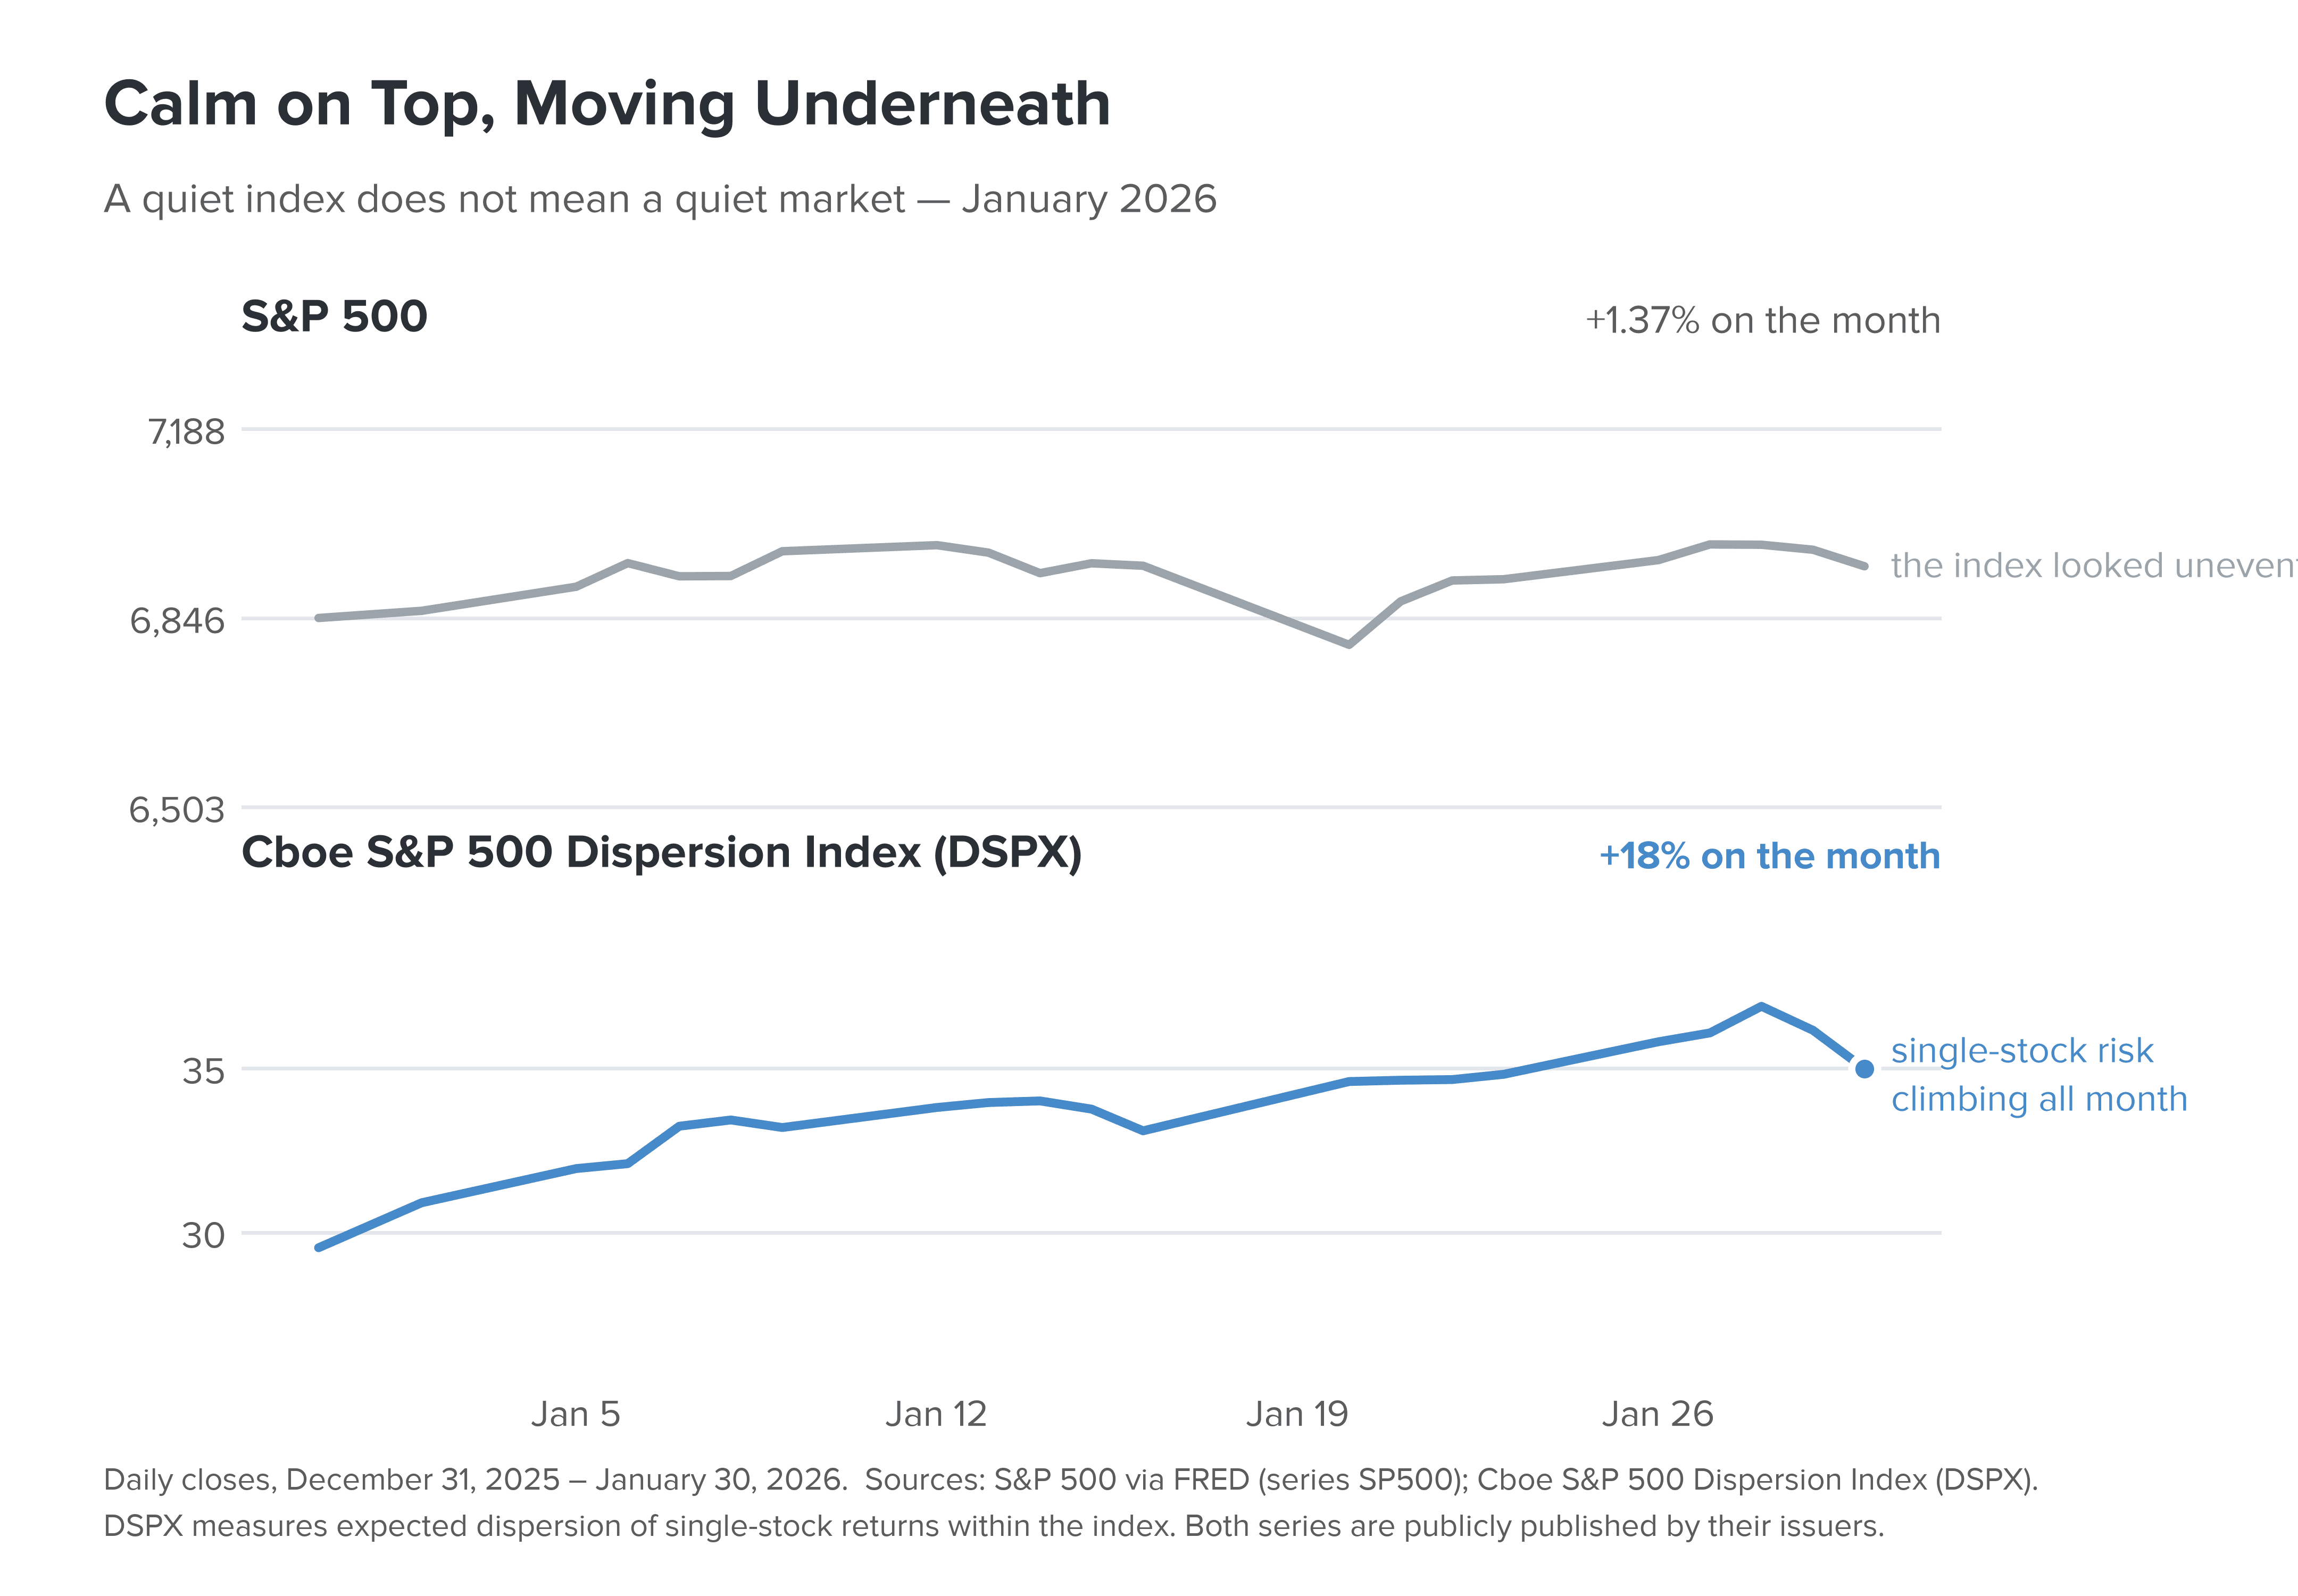
A quiet index does not mean a quiet market. It usually means the risk has moved somewhere the headline number cannot see it.
We had described this exact failure mode in our December letter: long-horizon trend following struggles when volatility spikes from short-term price extremes.
By March, the market was running the experiment. What started as weakness in software and AI-sensitive names spread into a broad deleveraging as geopolitical tensions escalated, and the decline was not really about earnings. It was about mechanics. As volatility expanded, systematic and volatility-targeting strategies were required to sell into falling prices, and that selling raised volatility further, which required more selling. This is a familiar feedback loop: volatility drives correlation, correlation amplifies losses, and investor behavior speeds up both.
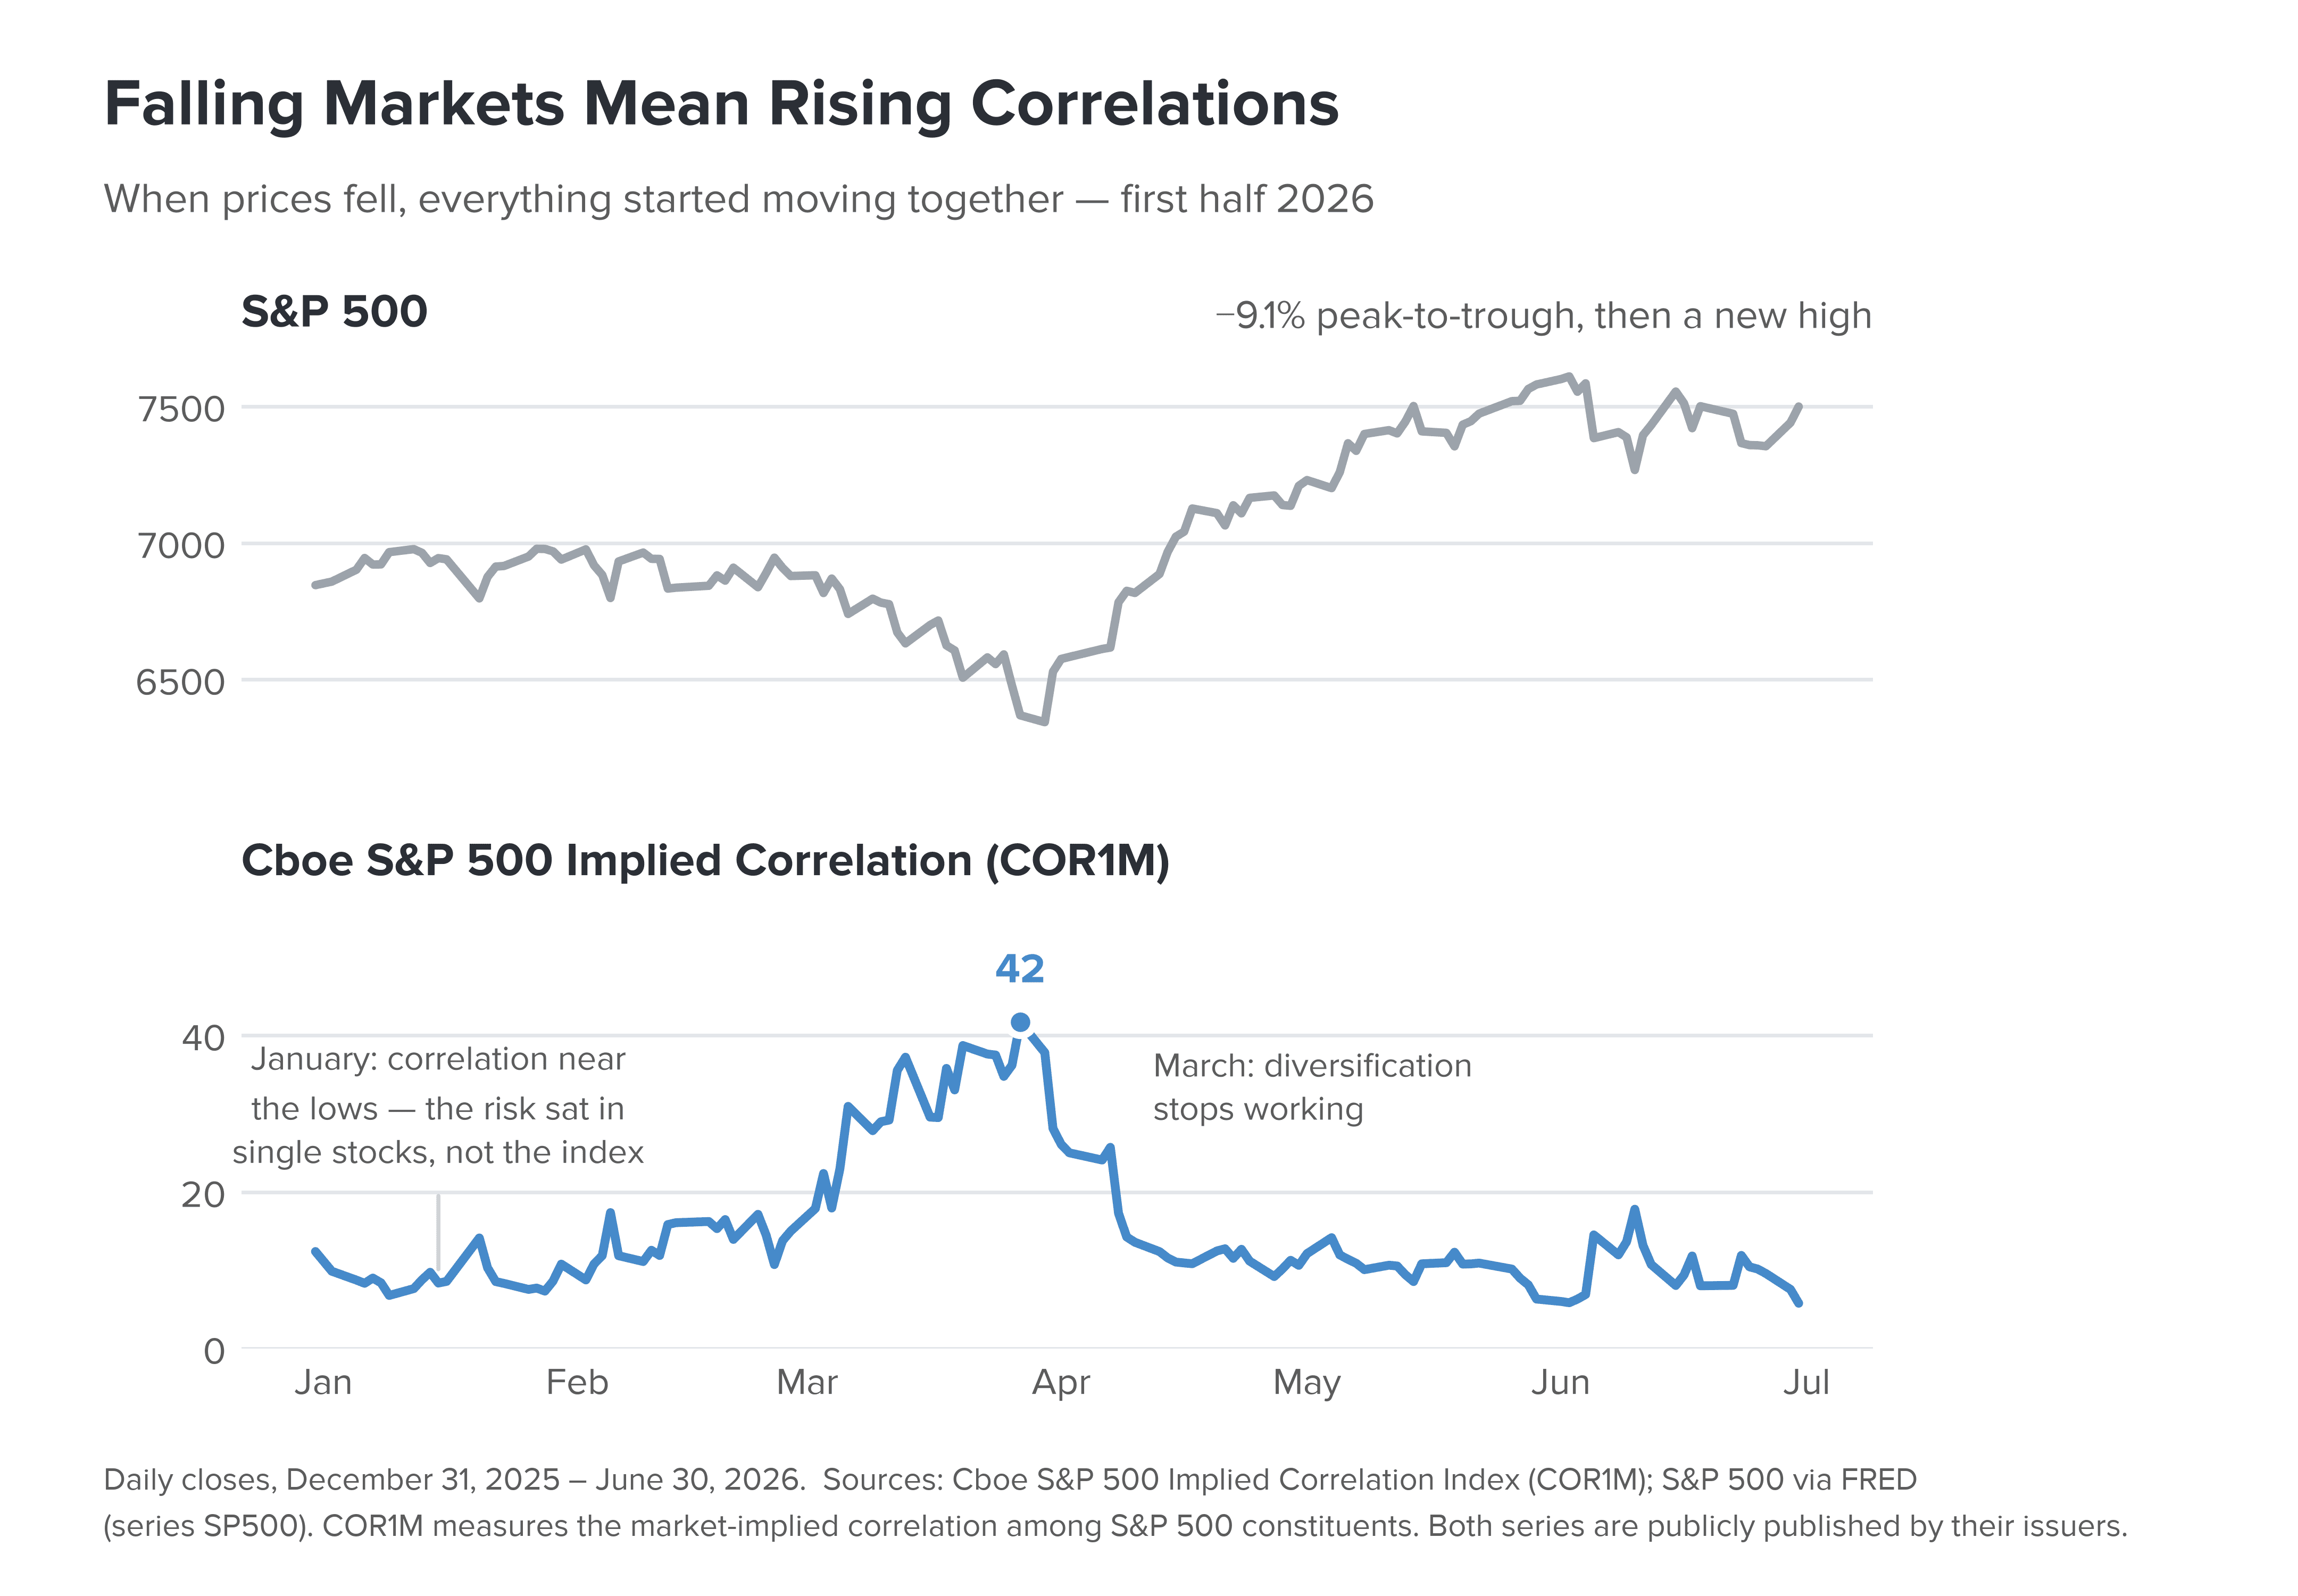
Falling markets mean rising correlations. Implied correlation sat near 9 in January — risk was concentrated in individual names, not the index. It peaked at 42 on March 27, then collapsed as the rally began. Sources: Cboe S&P 500 Implied Correlation Index (COR1M); S&P 500 via FRED.
By late March, trend-following strategies broadly had cut equity exposure hard, sentiment had reached levels usually seen at capitulation, and a number of long-horizon trend systems had mechanically flipped short near the lows. That is not a knock on those managers so much as a design characteristic: a long-term trend model is like a distance runner with one gear — enormously effective over open road, and in trouble when the pace changes violently in the span of a week.
Beneath the surface of the decline, the balance between risk and reward was improving even as headlines worsened. When the April 7 ceasefire announcement took the worst-case outcome off the table, the market did not walk higher. It sprinted. Short covering drove the first leg, systematic re-risking followed, and within a few weeks the S&P 500 had recovered the entire drawdown and made new highs.
Concentrating on Concentration
The second quarter was exceptional by any measure. The S&P 500 gained 14.87% and the Nasdaq-100 advanced 27.53%, and moves that large in that short a window are rare. By June, though, the question was no longer how strong the rally was. It was how few names were carry
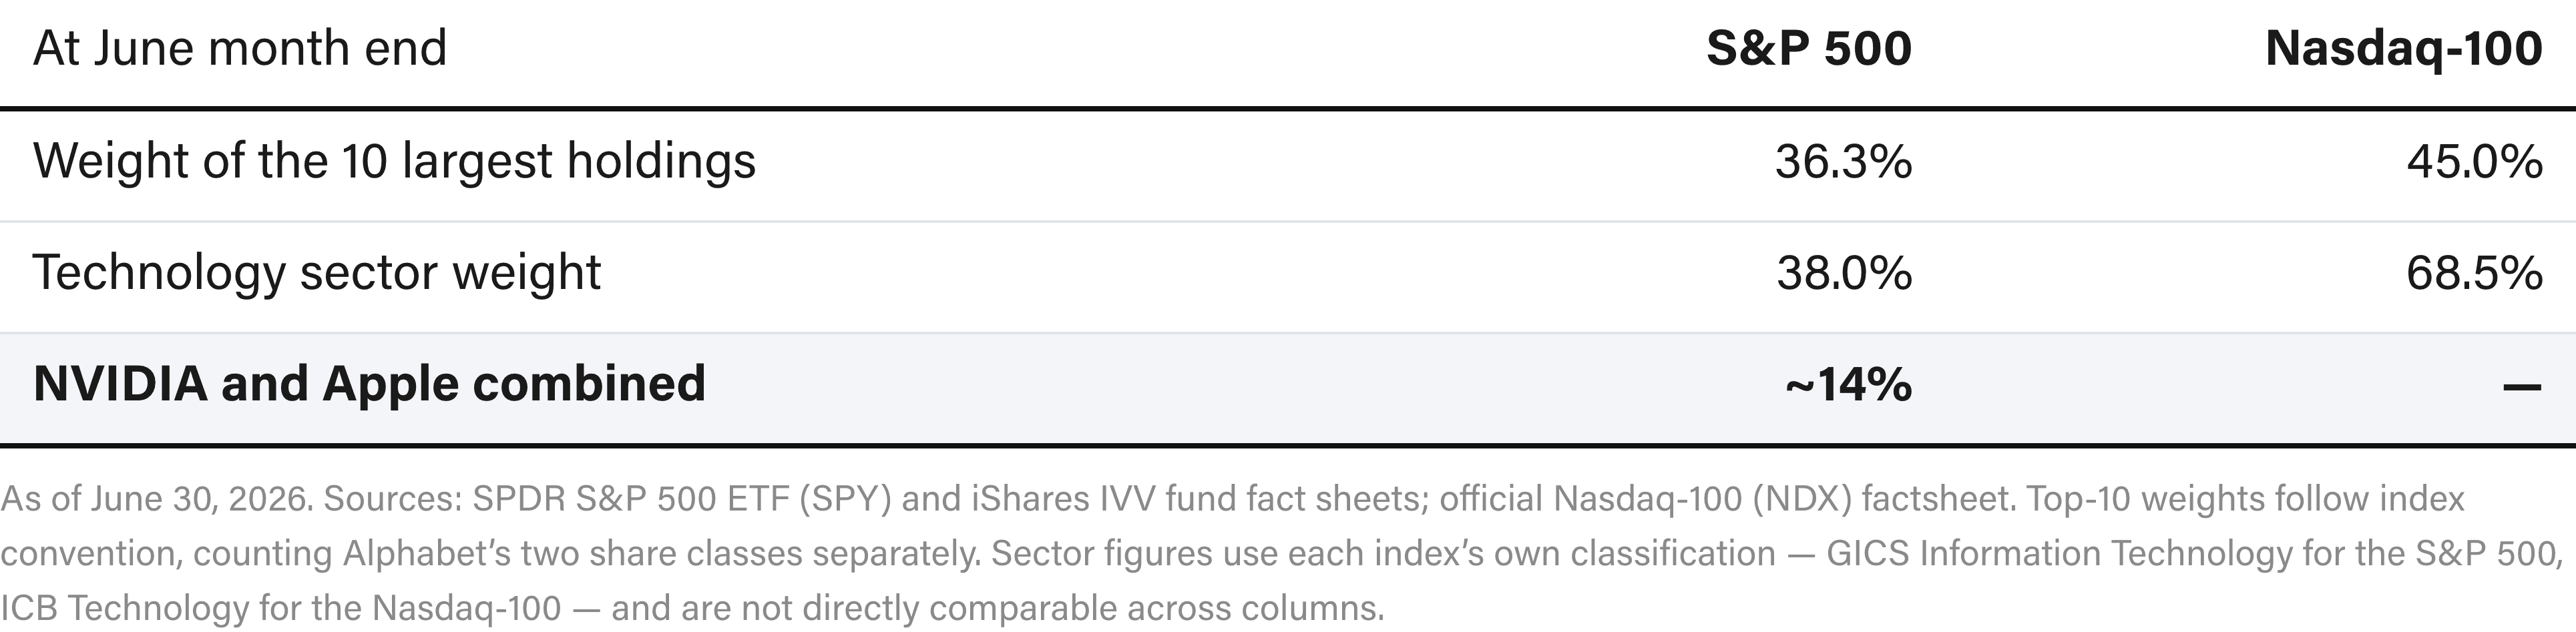
Index concentration is usually the byproduct of success: companies deliver strong earnings, their stocks rise, a bigger market capitalization means a bigger index weight, and a bigger weight draws more attention and more capital, which lifts the price again. That is not a flaw in the index. It is arithmetic. The trouble starts when expectations begin rising faster than those companies can beat them. Today’s concentration sits close to the extremes of the Nifty Fifty era and the dot-com period. That is not a prediction, and history does not repeat on schedule. It is a reminder that narrow leadership leaves investors more exposed than the headline index performance suggests.
Diversification stops being a question of how many names you own, and becomes a question of where the money actually is.
Volatility as Raw Energy
Volatility will always be a component of equity investing, but it doesn’t have to be feared. A quantitative framework can treat volatility as something to work with rather than something to survive: short-term price dislocations can offer opportunity and protection precisely when traditional trend-following models struggle.
Momentum trend following is the offense; volatility management is the conditioning. One puts points on the board. The other is why you are still standing in the fourth quarter.
Most investors do not fail because they picked the wrong asset class. They fail because a drawdown arrived at the wrong moment in their life and they could not stay in the seat. Reducing the depth and shortening the duration of drawdowns is what allows compounding to actually happen.
Three Things That Keep Proving True
Volatility arrives in clusters
January produced rising dispersion with no index-level warning. February and March produced the cluster. April produced the violent snap-back that clusters tend to generate. The sequence was not smooth or evenly distributed, and it was not forecastable from price trend alone.
Falling markets mean rising correlations
March showed the loop precisely as described, with implied correlation running from single digits to 42 in eight weeks. Diversification thinned out exactly when investors needed it most, and mechanical deleveraging pushed prices past anything fundamentals justified.
Investing with the trend isn’t enough
Trend following worked well in January and again from late April onward. It struggled at the March low, selling into capitulation and buying back higher. Recognizing that gap is central to how we think about risk.
The first half did not unfold according to a clean macro script. Markets rarely do. What mattered more was how positioning, volatility, and price dislocation evolved. Headlines and narratives change from cycle to cycle, but investor behavior is familiar. Understanding where the market sits within that progression remains an important foundation of our process.
The Second Half of 2026
We enter the second half constructive, but disciplined.
The primary trend in U.S. equities remains positive, supported by resilient earnings, improving liquidity and continued investment in AI capacity. The largest companies may well keep benefiting from real, durable drivers. We have no interest in arguing with that.
At the same time, the defensive positioning that powered April has now largely unwound. Risk assets have absorbed a great deal of good news in a short period. Breadth is narrower than the headline index suggests, and geopolitical and inflation risks remain unresolved. When ten companies make up more than a third of the S&P 500 and nearly half of the Nasdaq-100, owning the index means owning a concentrated bet whether or not it feels like one.
The risk is not only that today’s leaders could stumble. The risk is that investors believe they are more diversified than they actually are.
Three considerations frame the landscape from here:
Narrow leadership and crowded positioning in large-cap technology
Expectations around AI that now require continued execution and capital, not just enthusiasm
Mid-term elections in November, historically a source of short-term volatility
Our December view was that 2026 would be a year of sustained momentum interrupted by episodic volatility. Six months in, we see no reason to revise it. Like a swell crossing the ocean, strong trends can travel a long way before finally breaking on the shore. Periods of turbulence are part of the process, and often help shape the next opportunity.
Related Insights